Update, August 2026. This analysis covers a fixed 28-day window in mid-2026 and is left as it was published. The pool has grown since, and the picture has partly moved — so do not read the table below as current standings. The live figures on the quiz overview are recomputed nightly, and every category page carries its own.
What has held up: buildings and cars are still among the hardest categories, and the familiarity argument below still looks right. What has not: famous paintings have dropped from first place to mid-table, and nature — which had too little data to appear here at all — is now the hardest category we measure. Accuracy has risen in most other categories as the image pool has been refreshed.
One limitation named below has since been closed: the painting pool had no model attribution at all when this ran, and now every AI image in it carries a model name. The counts in the table's last column are the pool as it stood in July, not as it stands today.
Are some types of AI image easier to recognise than others? The usual advice suggests they should be. Cars expose broken geometry. Food can look suspiciously perfect. Famous paintings give us an original composition to compare against.
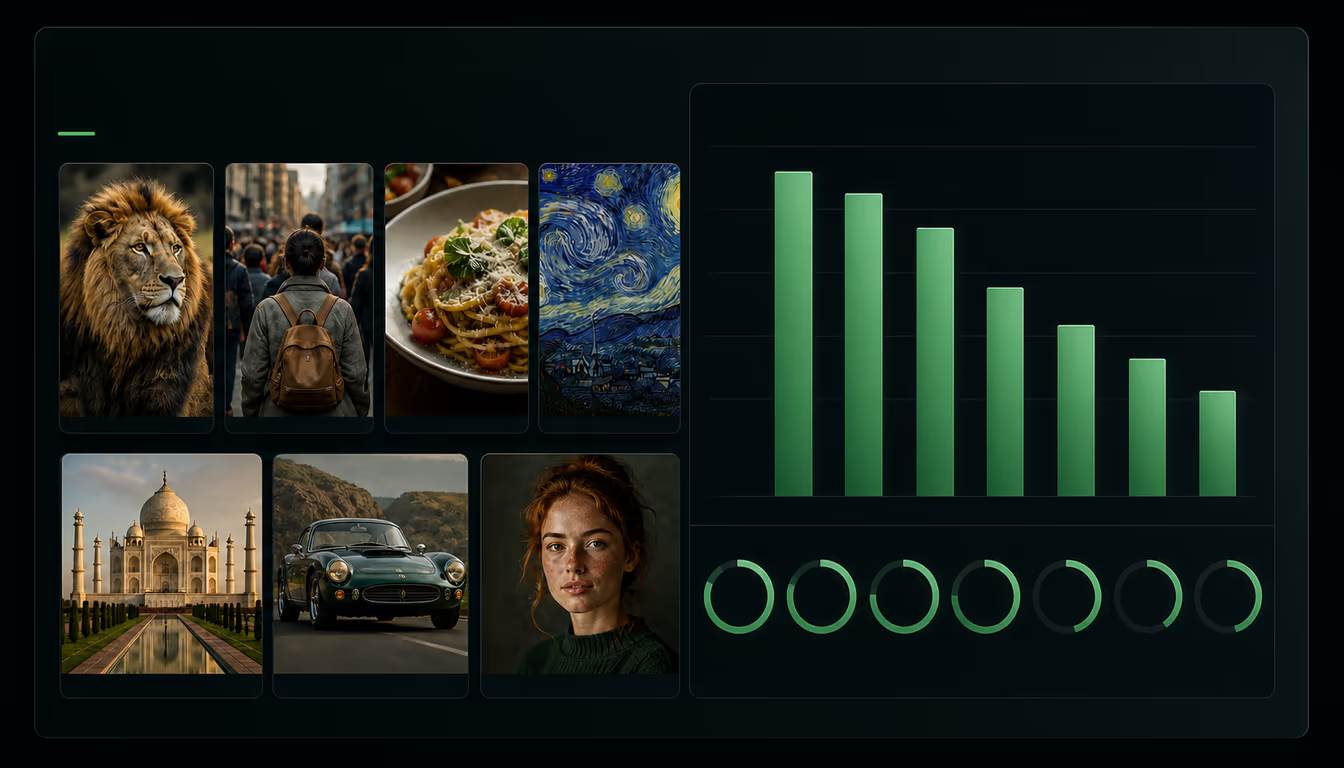
We tested that assumption with real play data from WhichOneIsReal covering the last 28 days: 25 June–22 July 2026, inclusive. Players completed 356 comparable category-specific image games. Each game contained ten decisions, giving us 3,560 real-versus-AI choices across six categories.
The result is not a simple league table. The apparent differences may come from the subject category, the AI models used in that category, the particular images in the pool, or a combination of all three. The available analytics cannot separate those effects.
The results
The accuracy below is the mean of the accuracy value recorded when a game was completed. We excluded mixed mode because it combines categories, and excluded video, text and specialist modes because they test a different task. We also excluded the Faces mode because it presents two choices per round, while every category below presents four; its accuracy is therefore not directly comparable.
- Stable Diffusion16
- Nano Banana Pro13
- GPT Image 1.59
- FLUX family9
- Kling5
- DALL·E / MS Designer4
- Seedream3
- Z-Image1
- Qwen Image Max1
- Imagen 41
- Lucid Realism1

- FLUX family10
- Kling5
- Z-Image5
- GPT Image 1.55
- Seedream 4.55
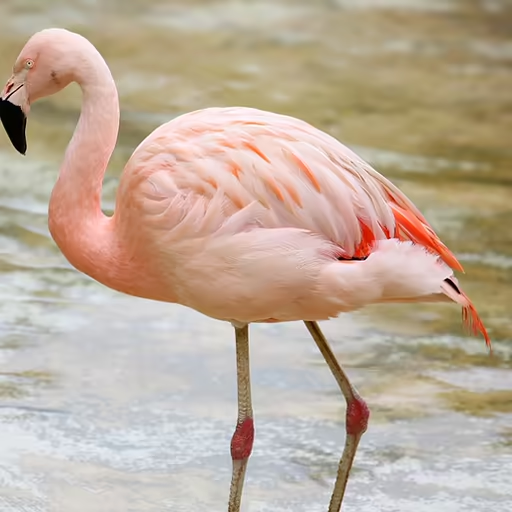
- FLUX family17
- Seedream 4.510
- Z-Image7
- GPT Image 1.55
- Kling2
- Nano Banana Pro1
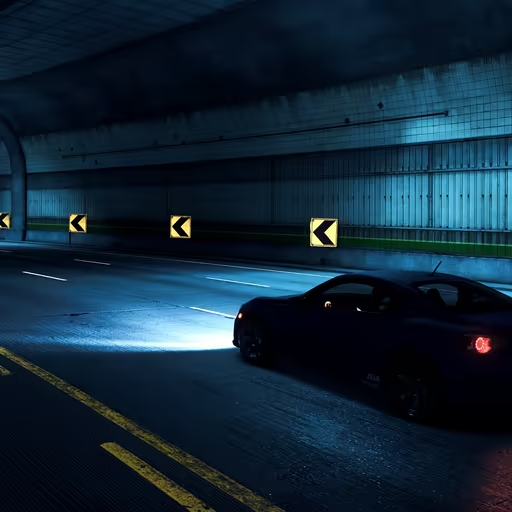
- FLUX family15
- GPT Image 1.54
- Kling4
- Z-Image3
- Seedream 4.53
- DALL·E 31
- MS Designer1
- Qwen Image Max1
- Lucid Realism1
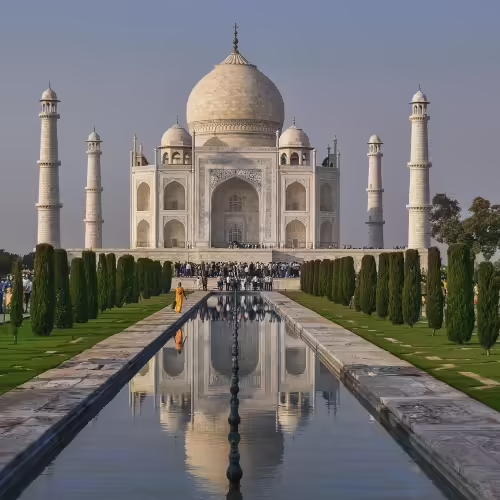
- Imagen 229
- DALL·E 35
- Amazon Titan5
- MS Designer3
- Stable Diffusion3
- FLUX Schnell1
- FLUX Dev1
- Lucid Realism1
How to read the model counts: "16 Stable Diffusion" means that 16 of the AI-generated images currently available in that category were made with Stable Diffusion. These are inventory counts, not correct answers, player impressions or the number of times Google Analytics recorded a model. Every round displays three AI alternatives and one real image. Because the export contains only category-level results, it does not reveal which of these images each player actually saw.
Why were buildings and cars so difficult?
Buildings and places produced the lowest accuracy: 35.9%. Cars followed at 36.5%. Both subjects share properties that favour current image generators.
Famous landmarks are photographed from a limited set of familiar viewpoints. Generators have seen countless images of the Eiffel Tower, Taj Mahal and Sydney Opera House, and they can reproduce the broad geometry, lighting and tourist-photo composition extremely well. A quiz player may know what the landmark looks like without knowing which particular photograph is authentic.
Cars have the same problem in a different form. Glossy paint, clean reflections, dramatic roads and showroom lighting are common in both advertising photography and AI training data. Synthetic cars can look more like an intentional photograph than a noisy, distant or poorly lit real image.
The model inventory also prevents us from assigning the result entirely to subject matter:
- 60.4% of the labelled landmark alternatives are Imagen outputs.
- 45.5% of the car alternatives come from the FLUX family.
That concentration creates a confound. The low landmark result could reflect the category, Imagen’s ability to reproduce famous architecture, the particular rounds in the pool, or all three. The same applies to cars and their concentration of FLUX images. It is entirely possible that part — or even most — of the apparent category difference is actually a model or image-pool effect. We would need per-round answer data with model labels — and preferably the same models represented across every category — to separate those effects reliably.
Animals and people landed near 50%
Players scored 49.4% on animals and 51.8% on people. These categories offer more possible clues than landmarks, but many of the old shortcuts have weakened.
Modern generators reproduce fur, feathers, skin and individual faces convincingly. The remaining errors are often relational: a paw meeting the ground incorrectly, a hand gripping an object without believable pressure, inconsistent eye reflections, or several people interacting without a physically coherent pose. Those details require slower inspection than counting fingers — a tell that has largely stopped working.
The people pool is especially useful for understanding category effects because its model mix is relatively balanced. FLUX accounts for one third of its alternatives, while Kling, Z-Image, GPT Image and Seedream each account for one sixth. No single family dominates the category, yet accuracy remained close to 50%. That makes “complex human interaction is difficult to inspect” a more plausible explanation than it would be in a category controlled by one model.
The animal pool is less certain. Ten of its 24 rounds have no saved model labels, and FLUX represents 40.5% of the alternatives that are labelled. We can describe the observed difficulty, but not cleanly attribute it to either animals or models.
Why food and paintings were easier
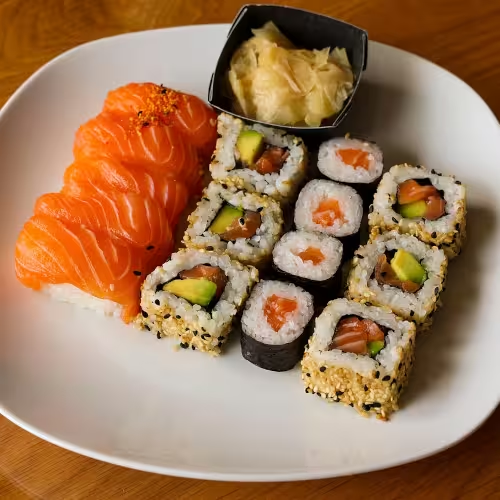
Food reached 60.2% despite having the broadest recorded generator mix. Stable Diffusion was the largest contributor, but it represented only a quarter of the alternatives. Nano Banana, FLUX, GPT Image, Kling, DALL·E and several other systems were also present.
That diversity makes a pure model explanation less convincing. Food may offer category-specific clues: repeated garnishes, implausibly tidy crumbs, sauce with an overly smooth texture, duplicated ingredients and lighting that makes every part of the dish look equally perfect. Real food photography is styled too, but it still contains small accidents that generation tends to remove.
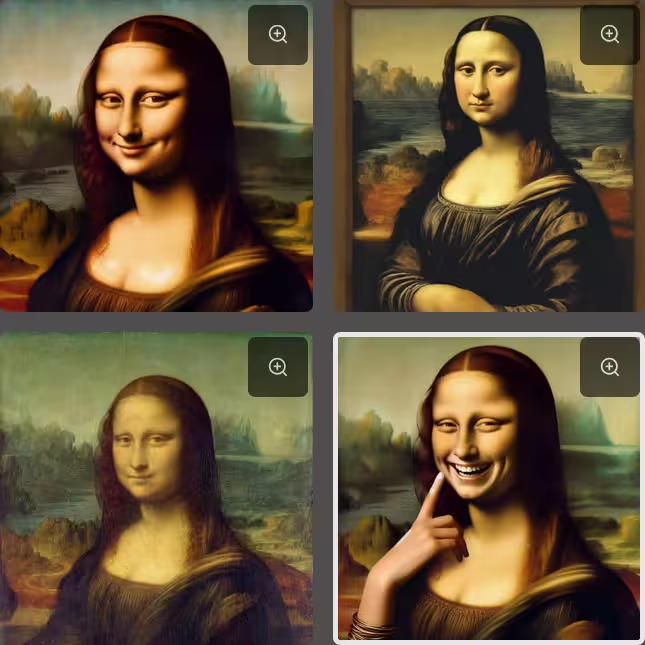
Paintings reached 67.1%, the best result among the four-choice categories. Familiarity probably helps. Many rounds use canonical works such as The Starry Night or Mona Lisa. Players may recognise the original composition, brushwork or proportions rather than detect a generic AI artifact.
There is also a hard limit to this interpretation: model labels were never stored for the ten legacy painting rounds. We cannot test whether their AI alternatives came from an easier or older generator set. Painting model attribution should be added before using this category in a model comparison.
Since publication: that has been done. Every AI image in the painting pool now carries a model name — 72 alternatives across 14 generators — so the category can be used in a model comparison from here on. The eleven legacy rounds already sitting in the analytics stay unattributable: there is no way to recover which generator produced an image that was never labelled.
What this study can — and cannot — tell us
This is behavioural data from real quiz sessions, not a controlled laboratory experiment.
- It covers one 28-day period and the content pool available during that period.
- The export contains completed-game totals, not per-round outcomes, so we cannot connect an individual mistake to a specific image or model.
- A completion is not necessarily a unique person; players may retry.
- Categories have different sample sizes. Cars has 31 completed games, while animals has 108.
- Model labels describe the pool as it stood during the study. They do not prove that every round or model was shown equally often during the analytics period.
- Some content in the pool at the time lacked model labels entirely.
- Models are not distributed evenly across categories, so the results cannot establish that subject matter itself caused the accuracy differences.
The safest conclusion is therefore:
In this dataset, players struggled most with cars and famous places, while paintings produced the highest accuracy. However, the model mix differs substantially between categories. The data therefore shows an association, not proof that the category itself caused the difference.
What we will measure next
Aggregate game accuracy is enough to reveal a pattern, but not enough to explain it. A stronger follow-up should record anonymous round-level outcomes alongside:
- category;
- generated model;
- scene or subject;
- answer position;
- whether model labels or Examine mode were enabled;
- first attempt versus replay;
- and a privacy-safe, non-identifying session key.
With that data, we could compare the same category across models, the same model across categories, and individual rounds within each pool. We could also identify which specific visual situations fool players — not merely which menu category they came from.
Update: that round-level recording is now running, and the first results are published as a live model rating — a Bradley-Terry score per generator, anchored so that real photographs sit at 1500. It answers the model question this analysis had to leave open, though it needs more rounds before the ordering between closely-matched models means anything.
For now, the most practical lesson is to slow down on architecture and vehicles. Do not rely on a landmark looking familiar or a car looking photographically polished. Check repeated structures, window and wheel geometry, reflections, contact with the road, background traffic and whether every perspective line belongs to the same scene — the relational checks from our guide to detecting AI images.
Put these numbers to the test — jump straight into the categories from this analysis:

Data and methodology
- Analytics source: aggregated Google Analytics
game_completeexport supplied by the site owner. - Period: last 28 days — 25 June–22 July 2026, inclusive.
- Included modes: animals, people, food, paintings, buildings-and-places and cars.
- Excluded mode: faces, because its two-choice format is not comparable with the four-choice category modes.
- Sample: 356 completed games; ten decisions per completed game; 3,560 decisions in total.
- Accuracy calculation: summed
accuracydivided by completed-game event count for each mode. - Model mix: counted from the model labels stored in the current repository content pool. Related model versions and aliases were grouped into families for readability.