![A real scarlet macaw photograph beside two AI-generated versions of the same scene, one from FLUX.1 [schnell] and one from SDXL-Lightning.](/assets/posts/sdxl-lightning-vs-flux-schnell-hero.avif)
FLUX.1 [schnell] and SDXL-Lightning have the same job: both are distilled, few-step models built for speed rather than maximum quality, and both are cheap or free to run wherever cost matters more than squeezing out the last bit of detail. That makes them natural rivals — so which one actually produces images that are harder to tell from a real photograph?
We didn’t ask either vendor. Both models are in our own real-vs-AI photo quiz, where a player sees a genuine photograph next to one or more AI alternatives and picks the one they think is real. Here is what our database says.
The short version: on the overall rating, the two are statistically tied — SDXL-Lightning’s 1,198 is only marginally above FLUX.1 [schnell]‘s 1,189, and their confidence ranges overlap almost completely. In head-to-head rounds where both appeared together, FLUX.1 [schnell] actually edges ahead slightly, 14.8% to 12.1% — the opposite ordering, which is itself the clearest sign this is a close race. The real story is in the categories: SDXL-Lightning is clearly stronger at paintings and animals; FLUX.1 [schnell] is clearly stronger at nature, people and sports.
How we measured this
Every round in our quiz shows one real photograph and one or more AI alternatives; the player picks the one they think is real. We fit a Bradley-Terry model across every first answer to every round, anchored so that genuine photographs sit at exactly 1,500. A model above 1,500 is fooling players more often than reality does; below it, players are catching it more often than not. The same method and the live numbers for every model in the quiz are published on our model ratings page, recomputed nightly.
Two things matter for reading what follows honestly:
- Sample size, not just the score. Both models here comfortably clear our floor of 10 distinct images and 30 rounds before a rating counts as solid — SDXL-Lightning on 63 images and 3,653 rounds, FLUX.1 [schnell] on 130 images and 10,083 rounds. Unlike some thinner models we’ve written about, neither number here is an early guess.
- Overlapping confidence intervals are not a ranking. Where two ranges overlap, treat the models as statistically level, not “X beats Y” — which turns out to be exactly the situation below.
Elo rating: statistically tied
Pulled from our database on 6 September 2026:
| Model | Rating | 95% range | Rounds | Distinct images shown | Status |
|---|---|---|---|---|---|
| Real photographs (anchor) | 1,500 | — | 22,549 | 267 | anchor |
| SDXL-Lightning | 1,198 | 1,180–1,217 | 3,653 | 63 | publishable |
| FLUX.1 [schnell] | 1,189 | 1,178–1,200 | 10,083 | 130 | publishable |
SDXL-Lightning’s point estimate sits 9 points above FLUX.1 [schnell]‘s, but the two 95% ranges overlap across almost their entire width — 1,180–1,200 is common ground to both. By our own rule for reading this data, that makes them statistically level, not a win for either side. This is a genuinely different situation from a comparison where the ranges don’t touch: here, more rounds could plausibly move the ordering either way.
The direct duel: same rounds, head-to-head
A cleaner test than comparing separate ratings is looking only at rounds where both models were shown at the same time, competing directly against the same real photo (and sometimes a third AI alternative too). This dataset has plenty of them — 2,461 matched rounds, far more than we’ve had for any comparison like this before.
| Outcome | Rounds | Share |
|---|---|---|
| FLUX.1 [schnell] picked as real | 365 | 14.8% |
| SDXL-Lightning picked as real | 298 | 12.1% |
| The real photo correctly identified | 1,405 | 57.1% |
| A third AI alternative picked instead | 393 | 16.0% |
Here FLUX.1 [schnell] comes out slightly ahead — the opposite ordering from the overall ratings above, where SDXL-Lightning had the (statistically insignificant) edge. That’s not a contradiction so much as the honest shape of a close race: the overall rating is fit across every round each model happened to appear in, mostly without the other one present, while the duel only counts the rounds where they went head-to-head directly. When two models are genuinely far apart, both cuts of the data agree. When they don’t agree, as here, that disagreement is itself evidence that any real gap is small.
Where each model actually wins
The category breakdown is where this comparison gets interesting — because unlike the near-tie overall, the per-category gaps are large. The image count next to each rate matters here as much as the rate itself: some of these results rest on a lot more pictures than others.
| Category | FLUX.1 [schnell] | SDXL-Lightning |
|---|---|---|
| Nature | 17.2% (279/1,618 · 23 images) | 7.9% (75/953 · 16 images) |
| Sports & action | 12.4% (74/596 · 14 images) | 4.9% (30/617 · 12 images) |
| People | 10.5% (147/1,405 · 15 images) | 3.5% (9/259 · 3 images) |
| Stuff (misc. objects) | 20.3% (13/64 · 27 images) | 20.6% (7/34 · 17 images) — roughly even |
| Animals | 7.6% (246/3,255 · 22 images) | 14.5% (142/981 · 4 images) |
| Paintings | 8.8% (167/1,900 · 19 images) | 14.5% (117/809 · 11 images) |
| Food | 16.9% (24/142 · 1 image) | not yet in the pool |
| Cars | 9.7% (68/698 · 7 images) | not yet in the pool |
| Buildings & places | 5.5% (30/542 · 2 images) | not yet in the pool |
FLUX.1 [schnell] more than doubles SDXL-Lightning’s pick rate on nature, people and sports & action. SDXL-Lightning returns the favour on animals and paintings. But look at the image counts before trusting every cell equally: SDXL-Lightning’s animals result comes from just 4 distinct images, its people result from just 3 — thin enough that one unusually convincing or unconvincing picture could swing the whole category. FLUX.1 [schnell]‘s food (1 image) and buildings & places (2 images) numbers are just as thin in the other direction. The paintings, nature and sports & action comparisons rest on a dozen or more images per side and are the ones worth trusting most.
A limitation this creates for the "statistical tie" headline above: SDXL-Lightning's pool only spans 6 of the 9 categories FLUX.1 [schnell] appears in — it has no images at all yet in food, cars or buildings & places. Its overall 1,198 rating is therefore an average over the subject matter it happens to have been generated for, not a representative cross-section like FLUX.1 [schnell]'s 130-image, 9-category spread. That matters because FLUX.1 [schnell] itself does relatively poorly in two of those missing categories — cars (9.7%) and buildings & places (5.5%), both below its own average. If SDXL-Lightning performed similarly there, its true all-subjects average could sit lower than 1,198 once it's tested on them. The rating comparison is still honestly measured on the images each model actually has; it just isn't yet a comparison of two models tested on the same range of subjects.
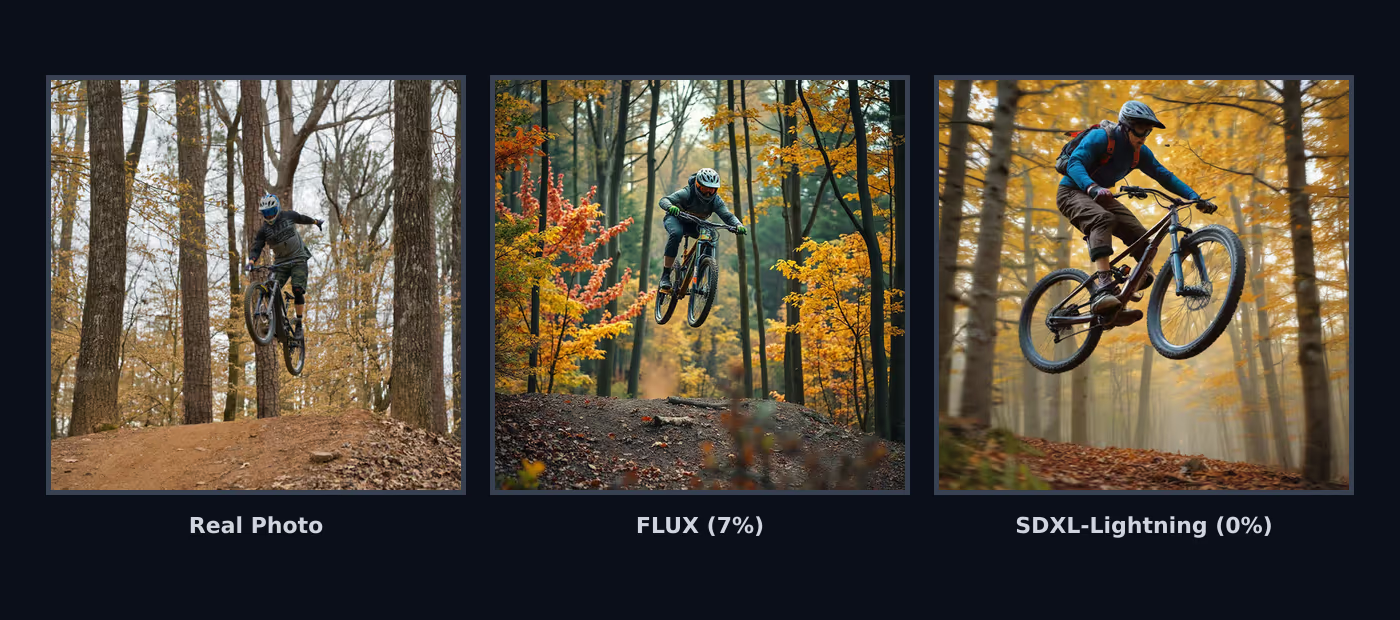
Same real photograph, opposite result from the hero image above. FLUX.1 [schnell]‘s version of this mountain-biking shot fooled 7% of viewers who saw it; SDXL-Lightning’s fooled nobody — 0 out of 75.
The best and worst individual images
Model averages hide how much a single picture can move the number. Among images shown at least 20 times:
FLUX.1 [schnell]‘s most convincing image was a couple dancing outdoors, fooling 47.4% of viewers (45/95) — no SDXL-Lightning version of this photo exists in the pool, so it stands on its own. Its least convincing was a photograph of an alligator, at 0.8% (1/129), also FLUX-only.
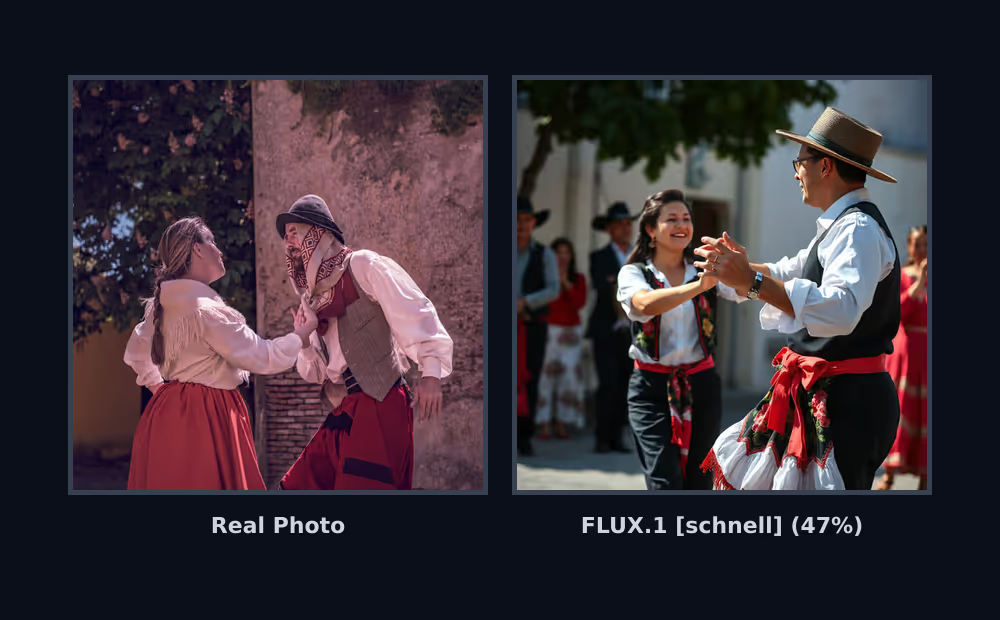
FLUX.1 [schnell]‘s single best result in this dataset — no matching SDXL-Lightning image exists for direct comparison.
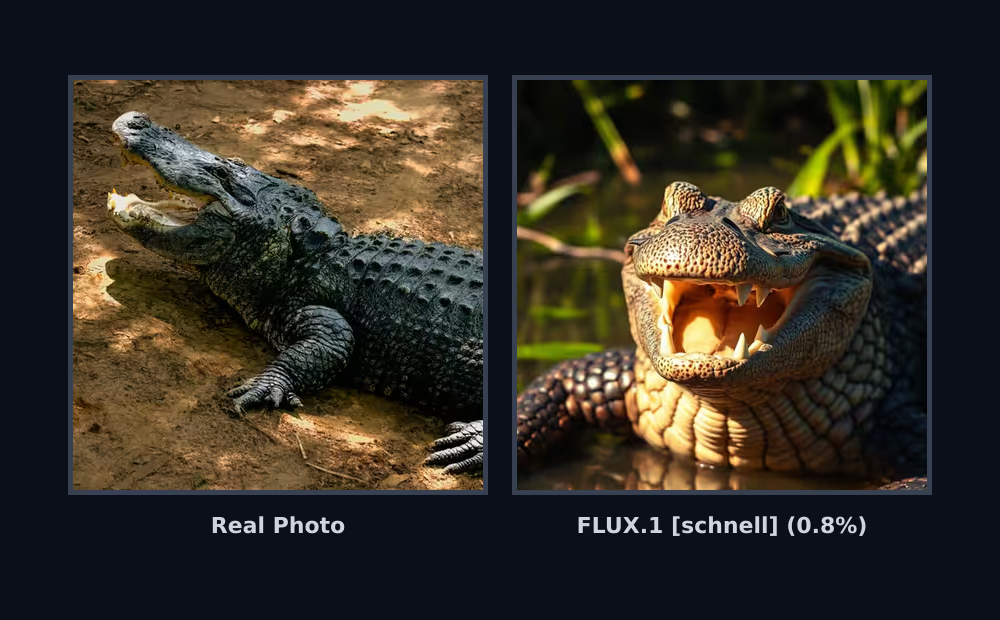
FLUX.1 [schnell]‘s worst result — players caught this one almost every time.
SDXL-Lightning’s actual best result is its rendering of Hokusai’s The Great Wave, which fooled 26.5% of viewers (26/98) — on the identical 98 exposures, FLUX.1 [schnell]‘s version of the same painting fooled just 16.3% (16/98):
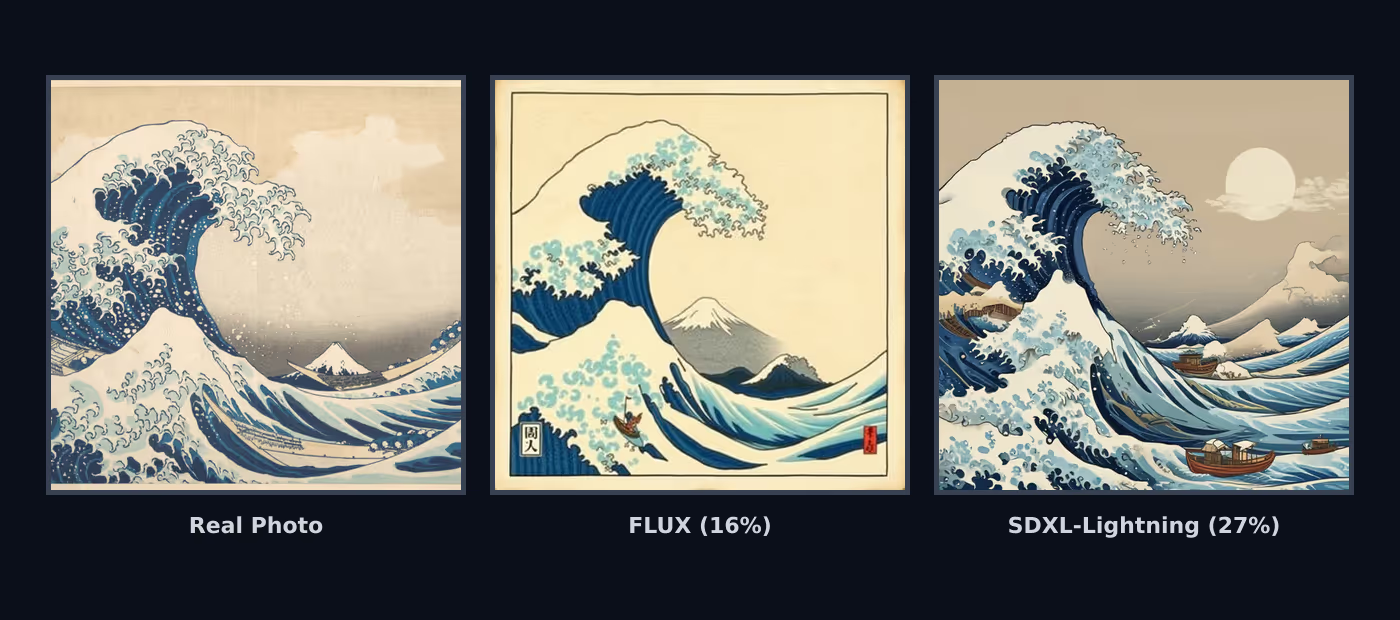
Same painting, same number of times shown to players. SDXL-Lightning’s version fooled players noticeably more often than FLUX.1 [schnell]‘s.
The scarlet macaw in the hero photo at the top is SDXL-Lightning’s second-best result (21.5%, 93/432) — not its top result, but the largest matched-exposure gap in the whole dataset: FLUX.1 [schnell] rendered the identical photo for the identical 432 exposures and managed just 5.8% (25/432). SDXL-Lightning’s worst result was the mountain-biking shot shown earlier, at 0.0% (0/75), where FLUX.1 [schnell] managed a modest 6.8% on the same photo. All three of SDXL-Lightning’s standout results — the wave, the macaw, the bike jump — land exactly where the category table says it should be strong or weak: paintings and animals up, sports & action down.
What the data actually shows
Judged purely on the overall rating, SDXL-Lightning and FLUX.1 [schnell] are close enough to call a tie — and the direct duel, which should be the cleanest test, actually points the other way. Neither model has a real overall edge in this dataset, and more rounds could tip the ordering either direction without that meaning anything changed. That “tie” also comes with the caveat above: SDXL-Lightning hasn’t been tested on the full range of subjects FLUX.1 [schnell] has, so its overall number may still move once it has.
What isn’t in question is the category breakdown. FLUX.1 [schnell] is the stronger choice for nature, people and action shots; SDXL-Lightning is the stronger choice for paintings and animals — though treat the animals and people results as provisional given how few images they rest on. If you’re picking a fast, low-cost model for a specific kind of image, that split is worth more than the headline rating — it says more about which model to reach for than “which one wins” ever could.
FAQ
Is SDXL-Lightning better than FLUX.1 [schnell] at photorealism?
Not decisively. SDXL-Lightning’s overall rating (1198) is marginally higher than FLUX.1 schnell’s (1189), on a scale where real photographs sit at 1500, but their 95 percent confidence ranges overlap almost completely, so the two are statistically level rather than one beating the other. In direct head-to-head rounds, FLUX.1 schnell was actually picked as real slightly more often, 14.8 percent versus 12.1 percent — the opposite ordering. Worth adding: SDXL-Lightning’s pool doesn’t yet cover food, cars or buildings and places the way FLUX.1 schnell’s does, so its overall number could still shift as it’s tested more broadly.
What does the Elo rating actually measure?
It is a Bradley-Terry paired-comparison score computed from real WhichOneIsReal quiz rounds. Every time a model’s image was picked as the real one counts as a win. Genuine photographs are anchored at exactly 1500, so a score above that means the model fools people more often than reality does, and a score below it means people caught it more often than they mistook it.
Which categories does each model actually win?
SDXL-Lightning is notably stronger at paintings, 14.5 percent versus 8.8 percent for FLUX.1 schnell, and animals, 14.5 percent versus 7.6 percent. FLUX.1 schnell is notably stronger at nature, 17.2 percent versus 7.9 percent, people, 10.5 percent versus 3.5 percent, and sports and action, 12.4 percent versus 4.9 percent. Treat animals and people cautiously though: SDXL-Lightning’s numbers there rest on only 4 and 3 distinct images respectively. Neither model has been shown enough in food, cars or buildings and places to compare there yet.
Why do the overall rating and the head-to-head duel point in slightly different directions?
The overall rating is fit across every round each model happened to appear in, most of which did not include the other model. The head-to-head figure only counts rounds where both were shown together. They are two different, both valid, cuts of the data, and when a genuine gap exists it usually agrees in direction. Here it does not, which is itself evidence that any real difference between these two models is small.
Can I test the two models myself?
Yes. Our image duel mode lets you challenge either or both models directly with the same real-vs-AI format used to produce the numbers in this article.
Data and methodology
- Source:
model_ratingsandimage_statsin the WhichOneIsReal database, queried on 6 September 2026. Ratings use only first answers per player per round to avoid counting a memory-assisted replay as a fresh judgment; see how we build the quizzes and the full methodology. - Head-to-head figures come from rounds where both models’ images were shown together, excluding replayed rounds within the same visit.
- Publishability floor: both models here clear our floor of at least 10 distinct images and 30 rounds before a rating counts as solid, consistent with how they’re flagged on our full ratings table.
- Pool composition is not matched between the two models. SDXL-Lightning appears in 6 of the 9 categories FLUX.1 [schnell] does, with no images at all yet in food, cars or buildings & places; several individual category results (SDXL-Lightning’s animals and people, FLUX.1 [schnell]‘s food and buildings & places) rest on fewer than 5 distinct images. See the caveat under “Where each model actually wins” for what that does and doesn’t undermine.
- All comparison images in this article — the hero photo, and every image embedded in the body — are real photographs and actual AI outputs from the quiz’s own content pool, composited together for side-by-side viewing. None of the illustrations here were separately generated for this article.
Our own numbers update nightly as more rounds are played; a rating this close is exactly the kind we’ll be watching for movement.